SeqCode: Set-Up
Downloading SeqCode: Files and Folders
SeqCode source code is entirely written in ANSI C. The latest full distribution release can be downloaded from GitHub:
This is the current list of archives and folders:
SeqCode integrates the source code of the SAMTools in C to read SAM/BAM files (which includes the BCFtools, the SAMtools and the HTSlib).
This is the current list of archives and folders:
-
README:
General description of the software and basic instructions to run SeqCode in your computer. -
LICENSE:
Open software license (GPL version 3.0). -
Makefile:
List of rules to make the binaries of SeqoCode applications. -
bin/:
Binary files to execute SeqCode applications. -
include/:
Headers and basic definitions for the source code. -
objects/:
Objects resulting from the make compilation. -
tests/:
Perl scripts to test the SeqCode binaries were successfully generated with real examples. -
src/:
SeqCode and SAMtools (BCFtools and HTSlib) source code.
SeqCode integrates the source code of the SAMTools in C to read SAM/BAM files (which includes the BCFtools, the SAMtools and the HTSlib).
How To Install SeqCode
Please, run the Makefile for automatically generating the SAMtools libraries and the SeqCode binaries.
Type 'make all' to generate SeqCode:
This is the full content of a successful compilation instance:
Depending on the user platform, some warning messages on the pthread library could be visualized when compiling the SAMtools. These messages can be safely skipped, not affecting the SeqCode binaries. It is possible to delete previous SeqCode binaries by typing 'make clean'.
This is the list of binaries provided into the bin/ folder which can be copied in the running path of your computer:
> make all
***** Step 1. Building the CRAM library           *****
gcc  -c -I./include -O2 -D_FILE_OFFSET_BITS=64 -D_LARGEFILE64_SOURCE -D_CURSES_LIB=1 ./src/cram/cram_codecs.c -o ./objects/cram/cram_codecs.o
(...)
***** [OK] CRAM library sucessfully generated     *****

***** Step 2. Building the HTSLIB library         *****
gcc  -c -I./include -O2 -D_FILE_OFFSET_BITS=64 -D_LARGEFILE64_SOURCE -D_CURSES_LIB=1 ./src/htslib/bgzf.c -o ./objects/htslib/bgzf.o
(...)
***** [OK] HTSLIB library sucessfully generated   *****

***** Step 3. Building the SAMTOOLS library       *****
gcc  -c -I./include -O2 -D_FILE_OFFSET_BITS=64 -D_LARGEFILE64_SOURCE -D_CURSES_LIB=1 ./src/samtools/bam_aux.c -o ./objects/samtools/bam_aux.o
(...)
***** [OK] SAMTOOLS library sucessfully generated *****

***** Step 4. Building the SeqCode suite          *****
gcc  -c -I./include -O2 -D_FILE_OFFSET_BITS=64 -D_LARGEFILE64_SOURCE -D_CURSES_LIB=1 ./src/seqcode/buildChIPprofile.c -o ./objects/seqcode/buildChIPprofile.o (...)
***** [OK] SeqCode suite successfully generated   *****
This is the full content of a successful compilation instance:
Depending on the user platform, some warning messages on the pthread library could be visualized when compiling the SAMtools. These messages can be safely skipped, not affecting the SeqCode binaries. It is possible to delete previous SeqCode binaries by typing 'make clean'.
This is the list of binaries provided into the bin/ folder which can be copied in the running path of your computer:
> ls bin/
buildChIPprofile
combineChIPprofiles
combineTSSmaps
combineTSSplots
computemaxsignal
findPeaks
genomeDistribution
matchpeaks
matchpeaksgenes
processmacs
produceGENEmaps
produceGENEplots
producePEAKmaps
producePEAKplots
produceTESmaps
produceTESplots
produceTSSmaps
produceTSSplots
recoverChIPlevels
scorePhastCons
Testing SeqCode: scripts, inputs and outputs
The tests/ folder contain a series of Perl scripts to test the correct functioning of each SeqCode command:
Each test can be executed with the option -v to see the messages of basic information:
To see the full verbose information of each SeqCode command, please use the option -w.
The input folder contains the original files employed throughout the test routines:
The output folder will contain the resulting output files generated during the tests by the user (one subfolder per program). Such results can be afterwards compared with the original resulting plots delivered in the finaloutputs folder, which is not ever rewritten by the execution of the abovementioned tests:
For each SeqCode command, users can check the resulting output of the tests performed on their computer:
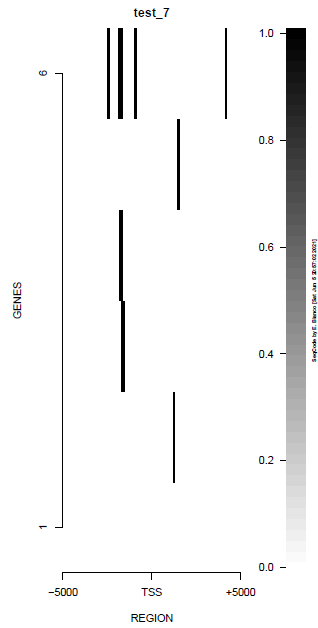
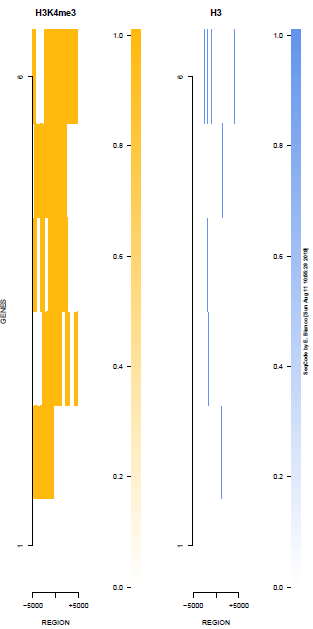
This is the panel of resulting plots for the test of the produceTSSmaps function:
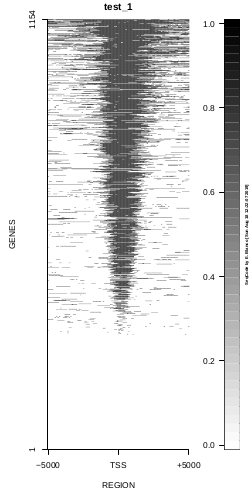
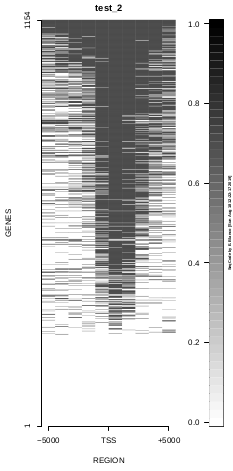
To generate a compact distribution of SeqCode, tests are performed in one locus of the genome. To have an idea of the whole picture (from which the test is extracted), this the panel of resulting plots in whole chromosomes for the test of the produceTSSmaps function (results not included in the tests/ folder):
>ls tests/
inputs
outputs
test_buildChIPprofile.pl
test_combineChIPprofiles.pl
test_combineTSSplots.pl
test_findPeaks.pl
test_genomeDistribution.pl
test_matchpeaksgenes.pl
test_matchpeaks.pl
test_produceGENEmaps.pl
test_produceGENEplots.pl
test_producePEAKmaps.pl
test_producePEAKplots.pl
test_produceTSSmaps.pl
test_produceTSSplots.pl
test_recoverChIPlevels.pl
Each test can be executed with the option -v to see the messages of basic information:
./tests/test_produceTSSmaps.pl -v

%%%% Starting SeqCode test for the produceTSSmaps tool by Enrique Blanco (Wed Jun 23 16:50:35 CEST 2021)

%%%% Stage 0.  Reading options [DONE]

%%%% Stage 1.  Running the test for H3K4me3 --chr10:5,774,999-6,225,000 (mm9)-- in mESC (default plot)
%%%% bin/produceTSSmaps -d tests/inputs/ChromInfo.txt tests/inputs/refGene_sample.txt tests/inputs/H3K4me3_sample.bam tests/inputs/genes_sample.txt test_1 5000 [DONE]

%%%% Stage 2.  Running the test for H3K4me3 --chr10:5,774,999-6,225,000 (mm9)-- in mESC (lower resolution)
%%%% bin/produceTSSmaps -d -w 1000 tests/inputs/ChromInfo.txt tests/inputs/refGene_sample.txt tests/inputs/H3K4me3_sample.bam tests/inputs/genes_sample.txt test_2 5000 [DONE]

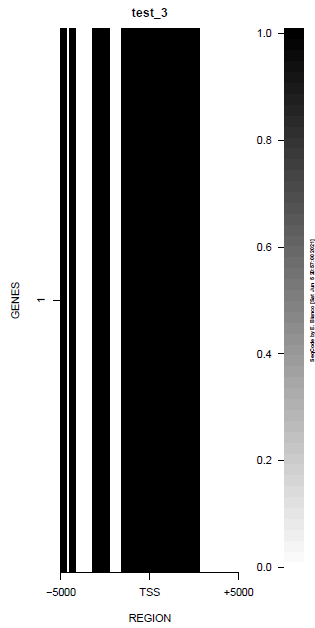
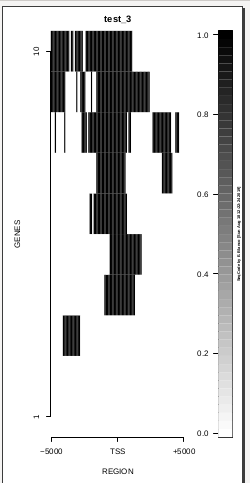
%%%% Stage 3.  Running the test for H3K4me3 --chr10:5,774,999-6,225,000 (mm9)-- in mESC (one gene, default plot)
%%%% bin/produceTSSmaps -d tests/inputs/ChromInfo.txt tests/inputs/refGene_sample.txt tests/inputs/H3K4me3_sample.bam tests/inputs/onegene.txt test_3 5000 [DONE]

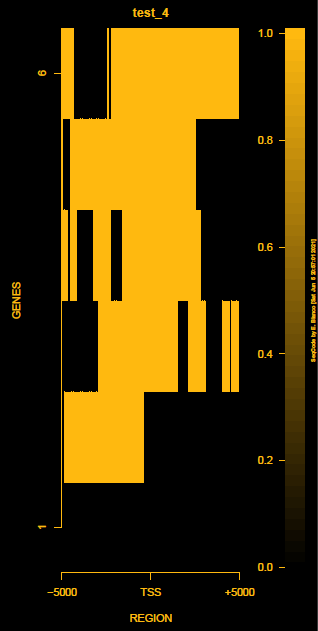
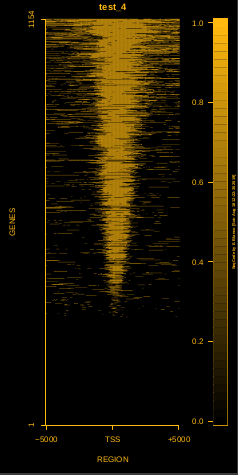
%%%% Stage 4.  Running the test for H3K4me3 --chr10:5,774,999-6,225,000 (mm9)-- in mESC (another color scheme)
%%%% bin/produceTSSmaps -d -b black -B black -H black -f darkgoldenrod1 -F darkgoldenrod1 tests/inputs/ChromInfo.txt tests/inputs/refGene_sample.txt tests/inputs/H3K4me3_sample.bam tests/inputs/genes_sample.txt test_4 5000 [DONE]

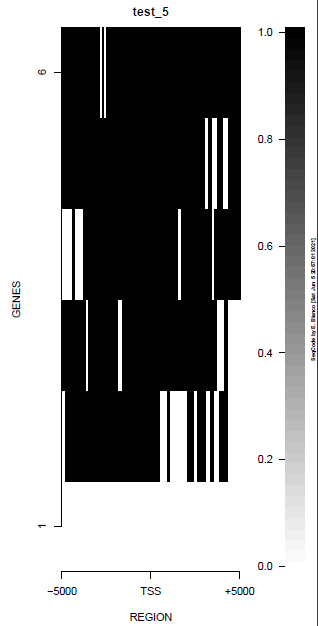
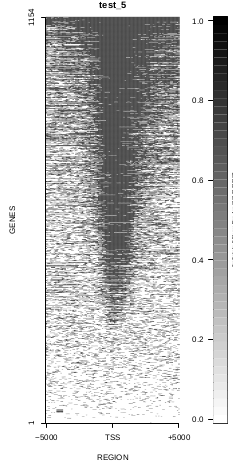
%%%% Stage 5.  Running the test for H3K4me3 --chr10:5,774,999-6,225,000 (mm9)-- in mESC (noise reduction plot)
%%%% bin/produceTSSmaps -d -t 0 tests/inputs/ChromInfo.txt tests/inputs/refGene_sample.txt tests/inputs/H3K4me3_sample.bam tests/inputs/genes_sample.txt test_5 5000 [DONE]

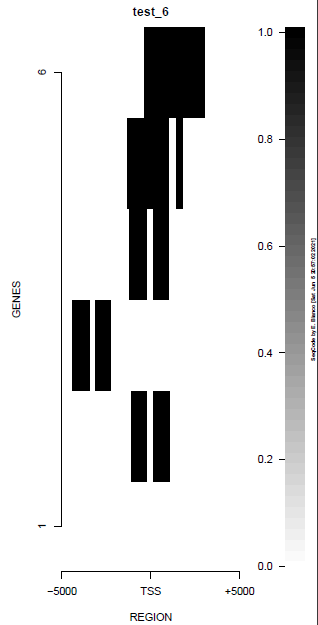
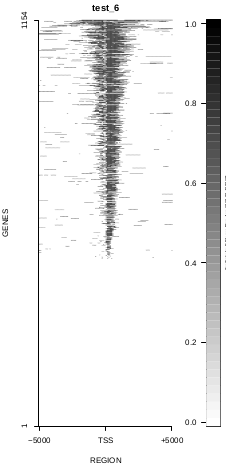
%%%% Stage 6.  Running the test for H3K4me3 --chr10:5,774,999-6,225,000 (mm9)-- in mESC (noise reduction plot 2)
%%%% bin/produceTSSmaps -d -t 2 tests/inputs/ChromInfo.txt tests/inputs/refGene_sample.txt tests/inputs/H3K4me3_sample.bam tests/inputs/genes_sample.txt test_6 5000 [DONE]

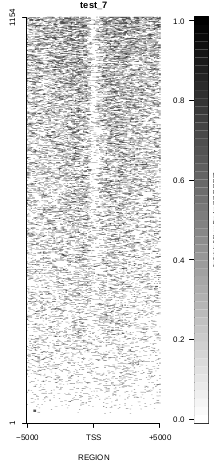
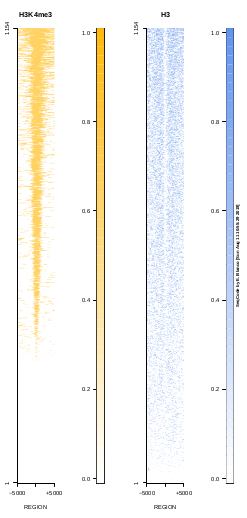
%%%% Stage 7.  Running the test for H3 --chr10:5,774,999-6,225,000 (mm9)-- in mESC (default plot)
%%%% bin/produceTSSmaps -d tests/inputs/ChromInfo.txt tests/inputs/refGene_sample.txt tests/inputs/H3_sample.bam tests/inputs/genes_sample.txt test_7 5000 [DONE]

%%%% R CMD BATCH tests/inputs/Rscript_produceTSSmaps.txt			      [DONE]

%%%% Stage 8.  Finishing the test (produceTSSmaps)
%%%% Checking output file 1: tests/outputs/produceTSSmaps/test_1_TSSmap_5000/PlotHEATmap_test_1_5000.pdf	[OK]
%%%% Checking output file 2: tests/outputs/produceTSSmaps/test_2_TSSmap_5000/PlotHEATmap_test_2_5000.pdf	[OK]
%%%% Checking output file 3: tests/outputs/produceTSSmaps/test_3_TSSmap_5000/PlotHEATmap_test_3_5000.pdf	[OK]
%%%% Checking output file 4: tests/outputs/produceTSSmaps/test_4_TSSmap_5000/PlotHEATmap_test_4_5000.pdf	[OK]
%%%% Checking output file 5: tests/outputs/produceTSSmaps/test_5_TSSmap_5000/PlotHEATmap_test_5_5000.pdf	[OK]
%%%% Checking output file 6: tests/outputs/produceTSSmaps/test_6_TSSmap_5000/PlotHEATmap_test_6_5000.pdf	[OK]
%%%% Checking output file 7: tests/outputs/produceTSSmaps/test_7_TSSmap_5000/PlotHEATmap_test_7_5000.pdf	[OK]
%%%% Checking output file 7 (2): tests/outputs/produceTSSmaps/produceTSS2maps.pdf				[DONE]

%%%% Total running time (hours): 0.001  hours
%%%% Total running time (minutes): 0.1  mins
%%%% Total running time (seconds): 6  secs
%%%% Successful termination:	   [DONE]
To see the full verbose information of each SeqCode command, please use the option -w.
The input folder contains the original files employed throughout the test routines:
> ls tests/inputs

ChromInfo.txt
genes_sample.txt
H3K27me3_chr10.bed
H3K27me3_mESC_sample.bed
H3K4me3_chr10.bed
H3K4me3_mESC_sample.bed
H3K4me3_sample.bam
H3_sample.bam
onegene.txt
onepeak.bed
refGene_sample.txt
Rscript_combineTSSplots.txt
Rscript_produceGENEmaps.txt
Rscript_produceGENEplots.txt
Rscript_producePEAKmaps.txt
Rscript_producePEAKplots.txt
Rscript_produceTSSmaps.txt
Rscript_produceTSSplots.txt
Rscript_recoverChIPlevels.txt
The output folder will contain the resulting output files generated during the tests by the user (one subfolder per program). Such results can be afterwards compared with the original resulting plots delivered in the finaloutputs folder, which is not ever rewritten by the execution of the abovementioned tests:
> ls tests/finaloutputs

buildChIPprofile
combineChIPprofiles
combineTSSplots
findPeaks
genomeDistribution
matchpeaks
matchpeaksgenes
produceGENEmaps
produceGENEplots
producePEAKmaps
producePEAKplots
produceTSSmaps
produceTSSplots
recoverChIPlevels
For each SeqCode command, users can check the resulting output of the tests performed on their computer:
> ls tests/outputs/produceTSSmaps

produceTSS2maps.pdf
test_1_TSSmap_5000
test_2_TSSmap_5000
test_3_TSSmap_5000
test_4_TSSmap_5000
test_5_TSSmap_5000
test_6_TSSmap_5000
test_7_TSSmap_5000
This is the panel of resulting plots for the test of the produceTSSmaps function:
| TEST 1 | TEST 2 | TEST 3 | TEST 4 |
|---|---|---|---|
 |
 |
 |
 |
| TEST 5 | TEST 6 | TEST 7 | TEST 7B |
 |
 |
 |
 |
To generate a compact distribution of SeqCode, tests are performed in one locus of the genome. To have an idea of the whole picture (from which the test is extracted), this the panel of resulting plots in whole chromosomes for the test of the produceTSSmaps function (results not included in the tests/ folder):
| TEST 1 | TEST 2 | TEST 3 | TEST 4 |
|---|---|---|---|
 |
 |
 |
 |
| TEST 5 | TEST 6 | TEST 7 | TEST 7B |
 |
 |
 |
 |