SeqCode: producePEAKplots
General description
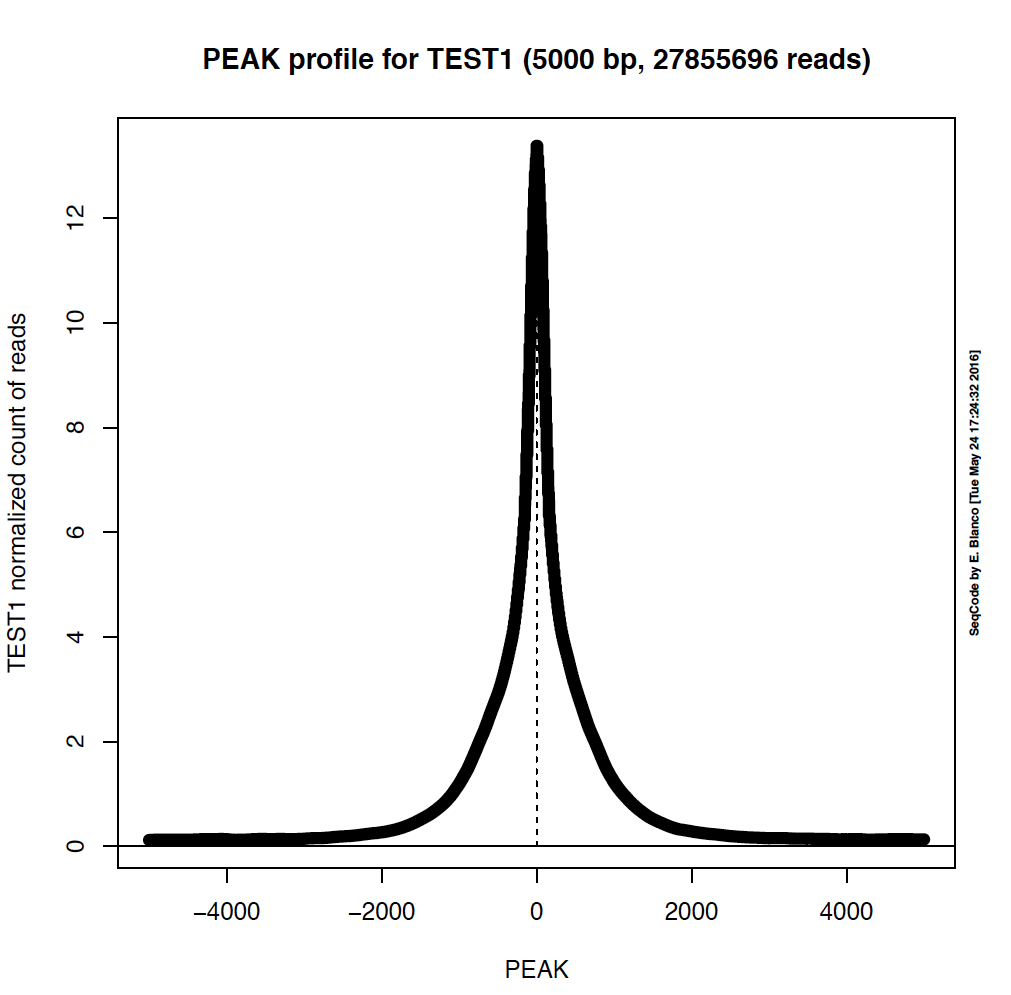
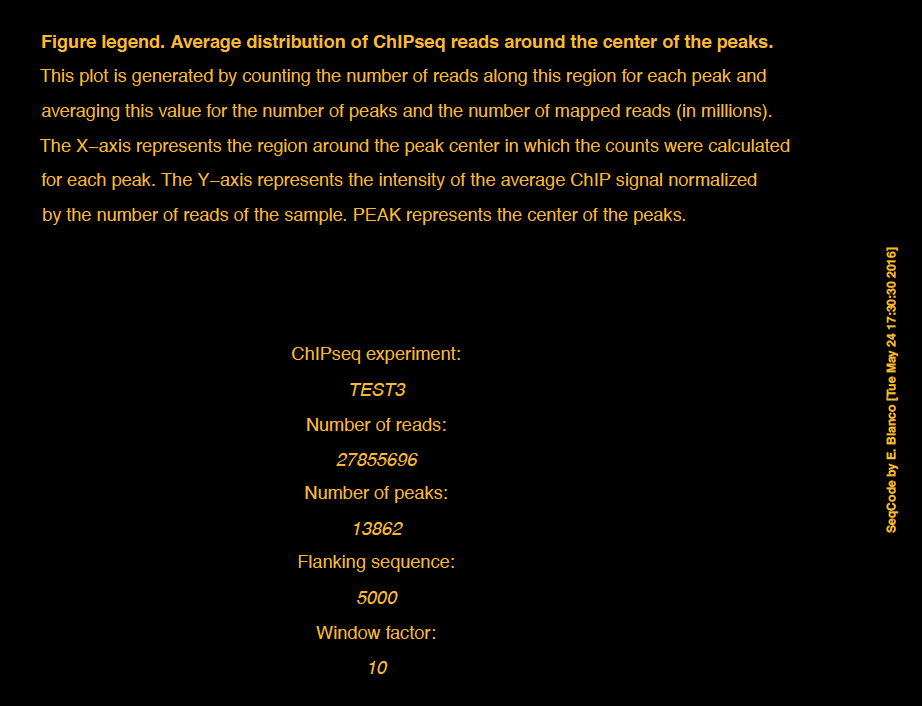
Generation of average distribution profiles of ChIPseq/ATACseq/RNAseq samples around the center of peaks.
> bin/producePEAKplots -h

SeqCode_v1.0						User commands						producePEAKplots

NAME
	producePEAKplots - a program to produce averaged ChIPseq/ATACseq/RNAseq metaplots centered in a list of peaks.

SYNOPSIS
	producePEAKplots [-bBfF <Rcolor>][-d][-l <bp>][-s <reads>][-u][-w <bp>][-v][-x prefix][-h]
	<chrom_info> <SAM file> <peaks.bed> <name> <length>

OUTPUT
	One folder with 4 files:
	- Peaks (max ChIP point).
	- Numerical distribution of reads.
	- R script commands.
	- Graphical representation (R is required).

OPTIONS
	-b : Background color (default: white).
	-B : General background color (default: white).
	-d : Demo mode for small BAM files (min number reads control off).
	-f : Foreground color (default: black).
	-F : General foreground color (default: black).
	-l : Avg. fragment size (default: 150).
	-u : Generate a uniform plot with Y axis in [0-1]).
	-s : Number of spike-in reads for reference-adjusted normalization.
	-w : Window resolution (default: 10).
	-v : Verbose. Display info messages.
	-x : Prefix for the output folder.
	-h : Show this help

SEE ALSO
	SeqCode homepage: http://ldicrocelab.crg.es
	GitHub source code: https://github.com/eblancoga/seqcode

AUTHORS
	Written by Enrique Blanco.

SeqCode_v1.0						User commands						buildChIPprofile
Examples
Example 1. How to generate a basic ChIPseq distribution plot around the center of peaks.
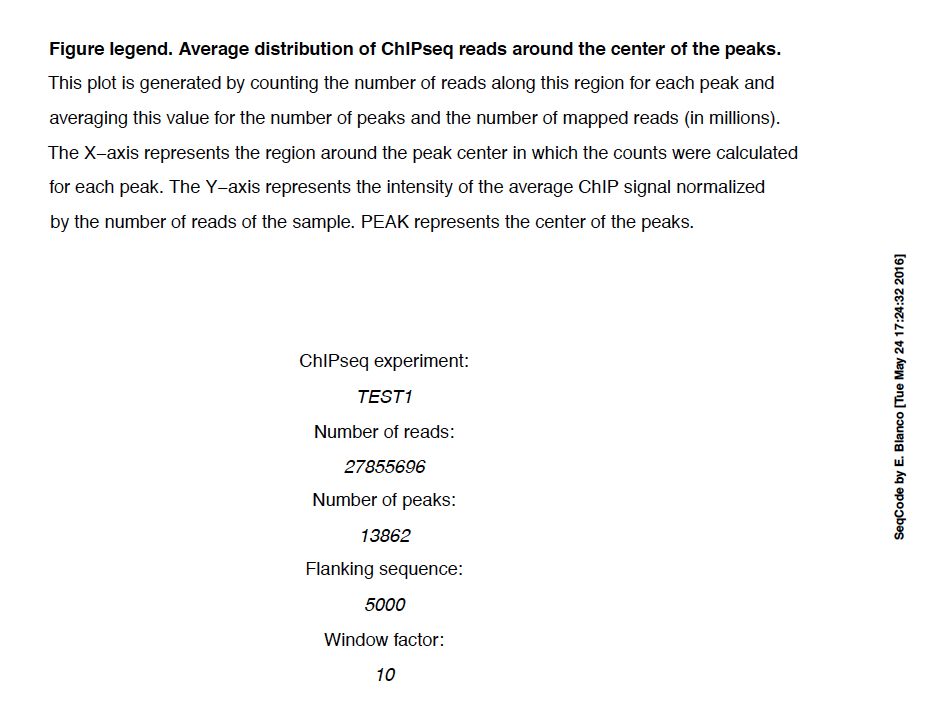
Example 2. How to change the background and the foreground colors of the PEAK plot.
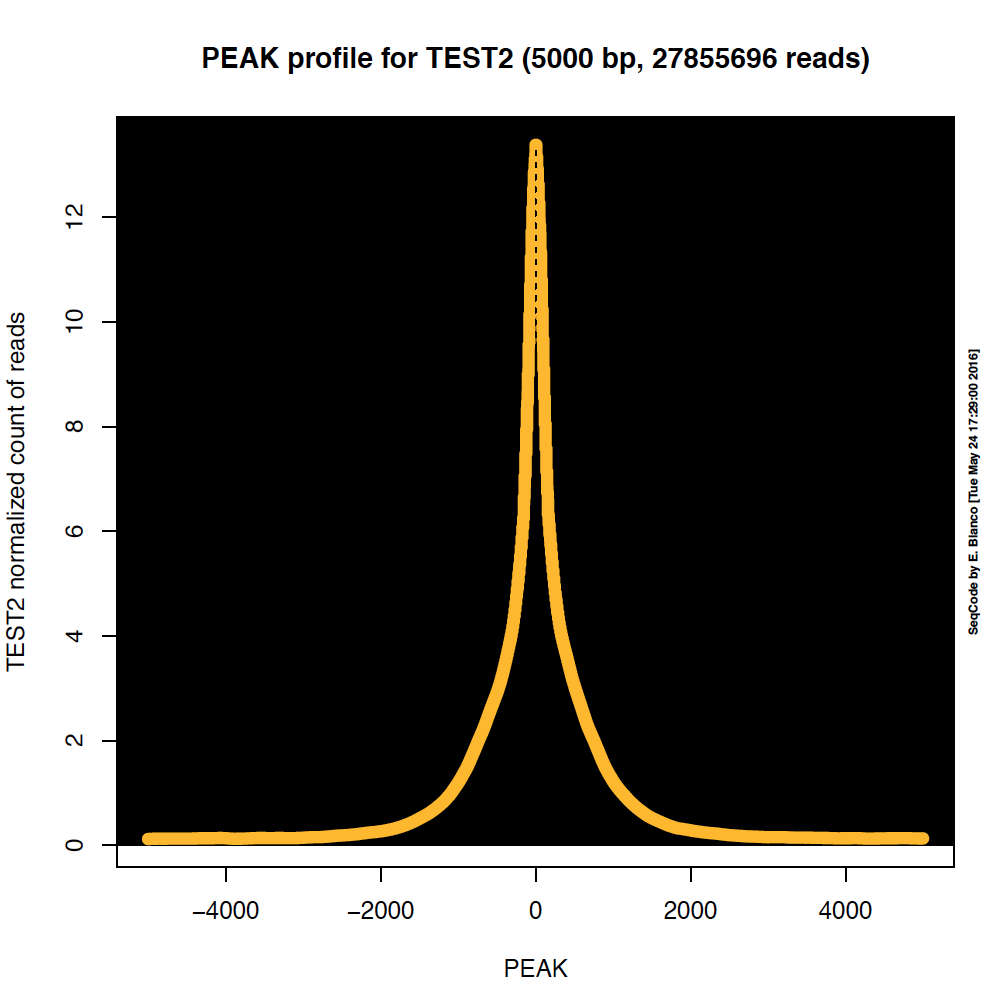
Example 3. How to change the background and the foreground colors of the framebox of the PEAK plot.
Example 4. How to change all the background and the foreground colors of the PEAK plot.
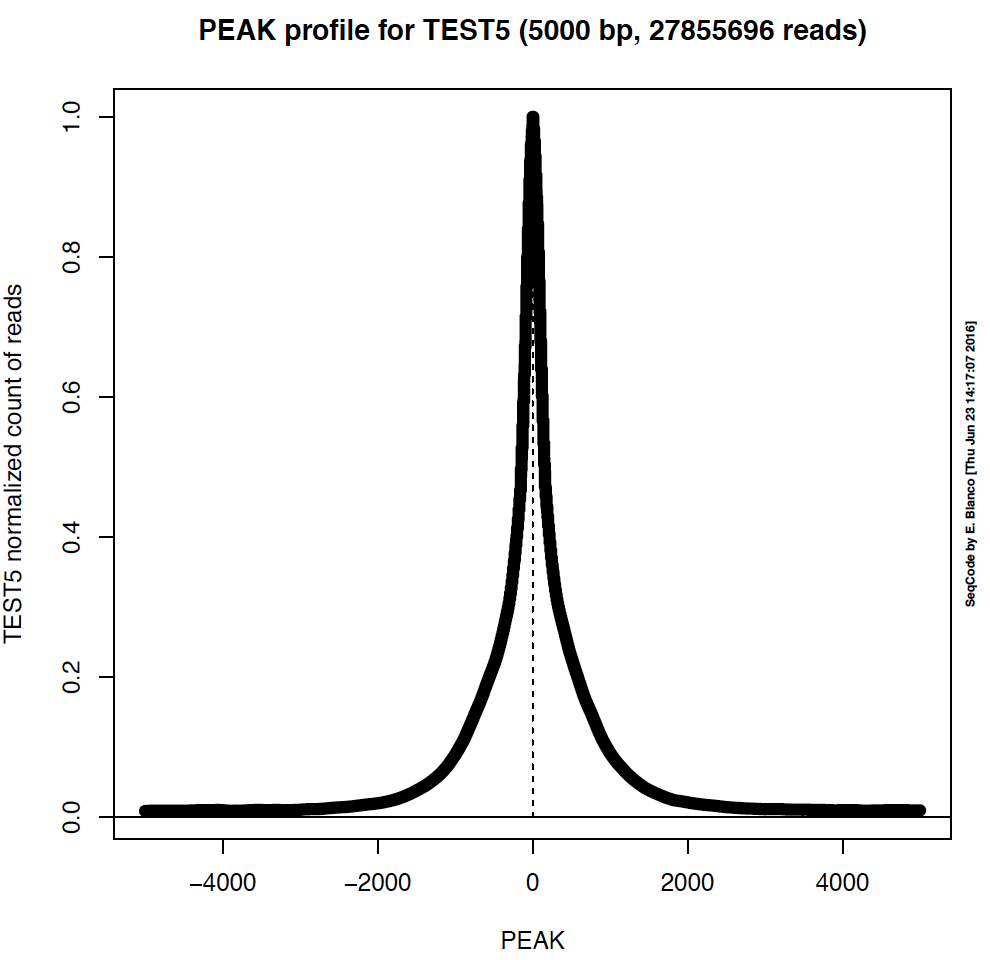
Example 5. How to generate a normalized plot in which the Y axis is between 0 and 1.
Example 6. How to decrease the resolution of the picture to generate a plot with lower memory requirements.

> bin/producePEAKplots -v ChromInfo.txt SRR1015741.bam H3K4me3_peaks.bed TEST1 5000
Example 2. How to change the background and the foreground colors of the PEAK plot.
> bin/producePEAKplots -v -b black -f darkgoldenrod1 ChromInfo.txt SRR1015741.bam H3K4me3_peaks.bed TEST2 5000
Example 3. How to change the background and the foreground colors of the framebox of the PEAK plot.
> bin/producePEAKplots -v -B black -F darkgoldenrod1 ChromInfo.txt SRR1015741.bam H3K4me3_peaks.bed TEST3 5000
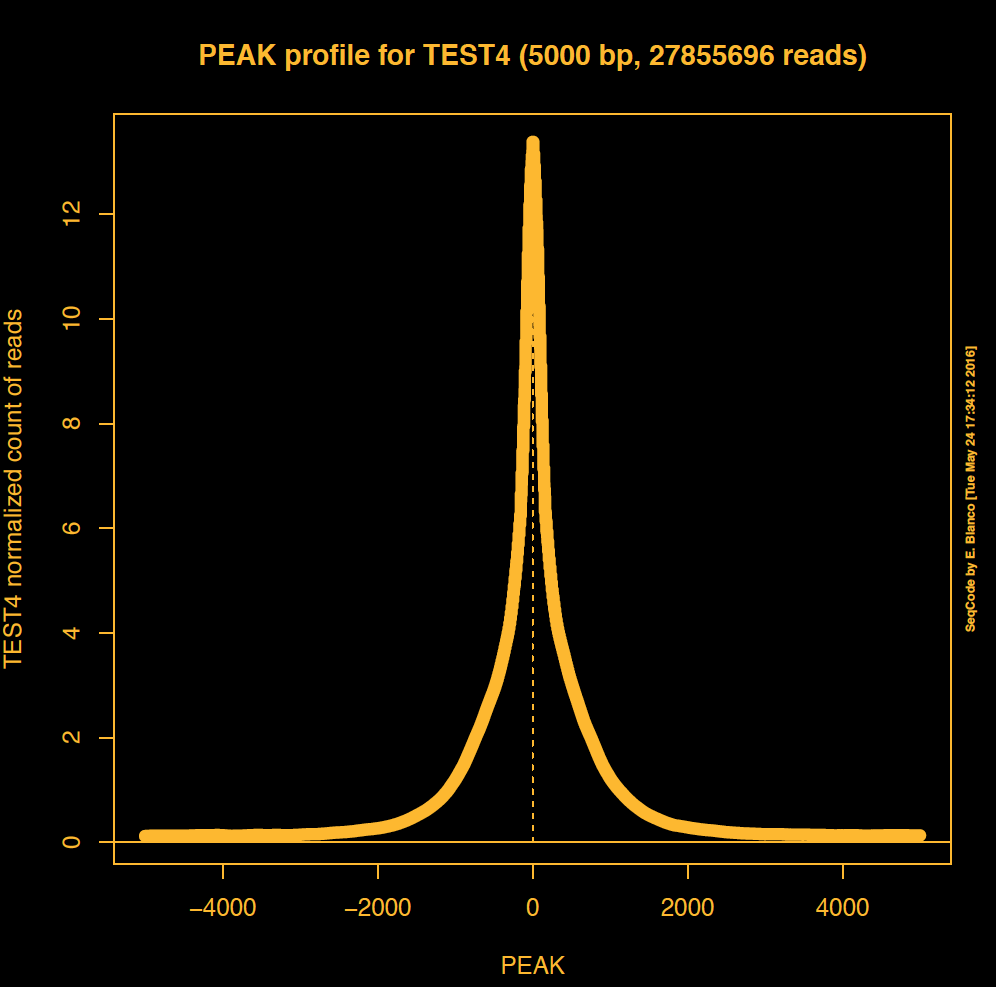
Example 4. How to change all the background and the foreground colors of the PEAK plot.
> bin/producePEAKplots -v -B black -b black -F darkgoldenrod1 -f darkgoldenrod1 ChromInfo.txt SRR1015741.bam H3K4me3_peaks.bed TEST4 5000
Example 5. How to generate a normalized plot in which the Y axis is between 0 and 1.
> bin/producePEAKplots -v -u ChromInfo.txt SRR1015741.bam H3K4me3_peaks.bed TEST5 5000
Example 6. How to decrease the resolution of the picture to generate a plot with lower memory requirements.
> bin/producePEAKplots -v -w 100 ChromInfo.txt SRR1015741.bam H3K4me3_peaks.bed TEST6 5000
ChIPseq and RNAseq samples
Please, follow the link below for further information on how to get and preprocess the raw data of
published ChIPseq and RNAseq samples utilized in this glossary of SeqCode functions.
[SAMPLES]
[SAMPLES]