NGS Tools
ChIPseq maps & plots
Data Sets
Graphical distributions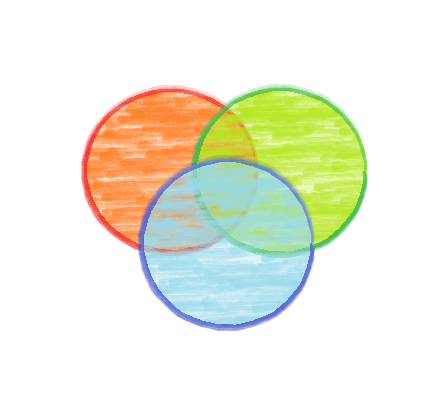
Gene Sets
Overlap of groups
Regulatory Sets
Catalog search
List Ops
Tabular archives
Docs
Help and tutorials
Downloads
Software distribution
SeqCode is a suite of open software command line tools to develop high-quality pictures from high-throughput sequencing samples. The source code is elegantly designed to be integrated into existing bioinformatics pipelines. SeqCode web is a web interface implemented to show only a selection of the features of the standalone distribution.
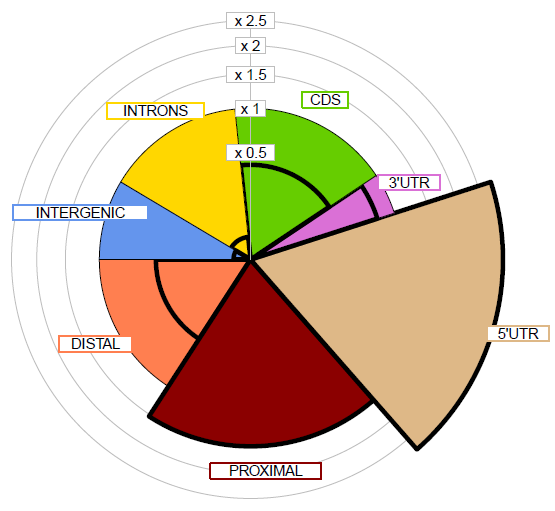
SeqCodeweb is able to perform the annotation of peaks into distinct genome regions such as promoters, exons or intergenic and the association to RefSeq genes from multiple genome assemblies according to configurable distance rules. Moreover, users can compare two sets of peaks to find overlapping regions and specific instances of each set.
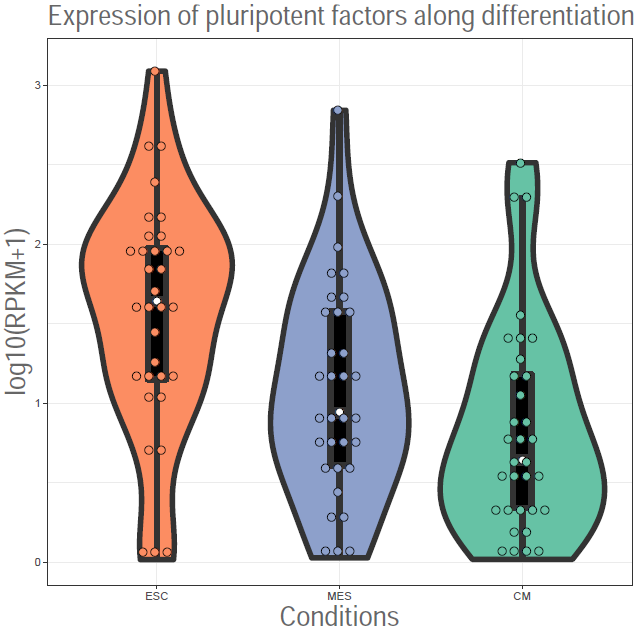
SeqCodeweb provides tools to generate boxplots and violin plots of the distributions of values for generic elements. From the full distribution of values for all elements, it is possible to generate the boxplot for selected conditions or elements. Boxplotter3 generates high-quality and elegant representations such as violin plots together with other enhanced features.
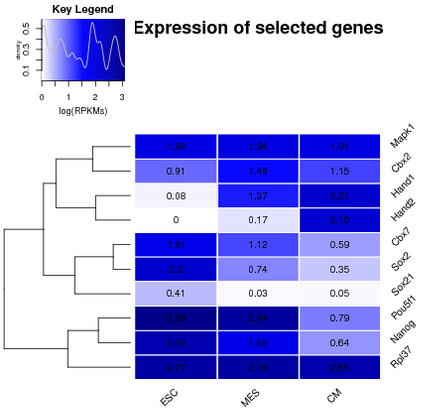
SeqCodeweb offers the users the option to generate a heatmap of a list of genes for which the values in multiple experimental conditions are known (e.g. RNAseq expression or ChIPseq normalized reads). A vast range of graphical and clustering options are implemented to customize the resulting picture.
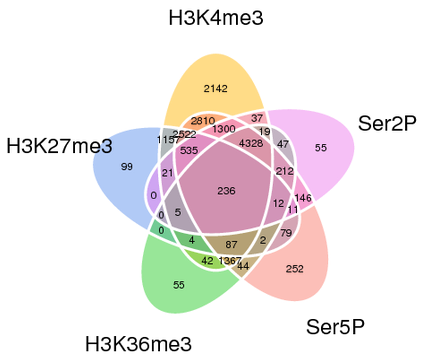
SeqCodeweb implements different alternatives to compare two lists of names. Users can perform the comparison between two sets, which generates a Venn diagram with size proportion and the resuting sets of common and specific instances or generate a Venn diagram from more than two input lists.
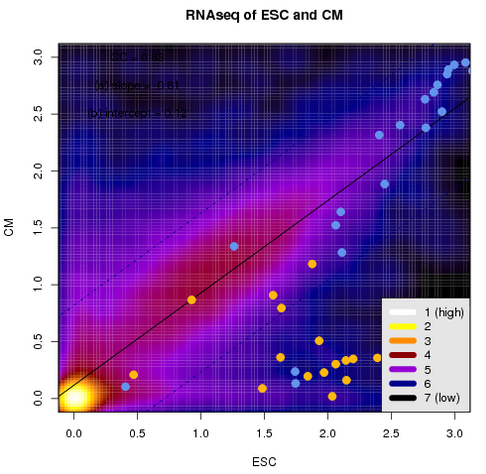
SeqCodeweb is useful to generate scatterplots from the distribution of 2 values for a set of instances. Linear regression is also calculated to calculate the correlation between both features. Two additional subsets of points can be highlighted. Other options to filter null instances and multiple palettes of colors are available.
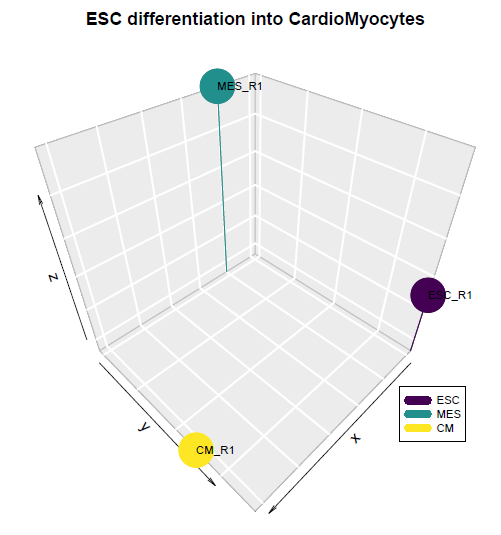
SeqCodeweb provides several apps to perform and graphically display Principal Component Analysis of series of data (e.g. expression data). Users can group samples into different clusters to be shown using distinct colors in the PCAplot. Using two principal components (2D) or three principal components (3D), it is possible to present in the space the set of NGS experiments to check how well replicates fit into similar areas of the analysis.
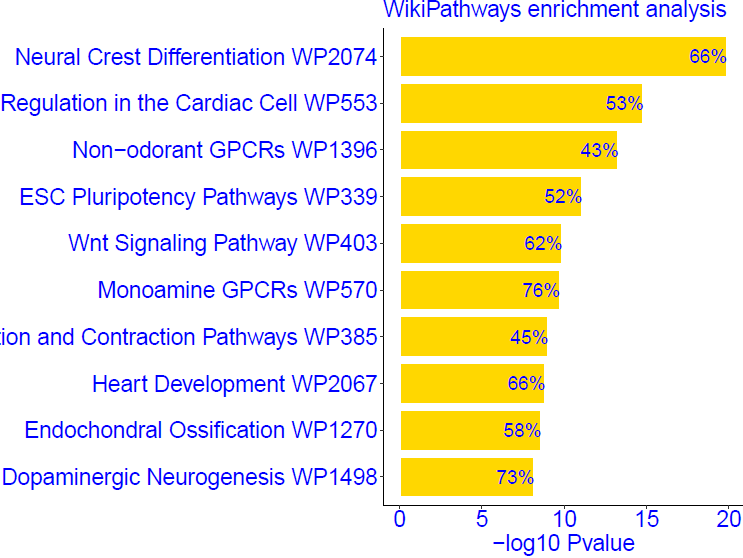
Users can generate high-quality barplots with functional term enrichment analysis using SeqCodeweb. Data from manual input or retrieved from Enrichr website is automatically processed and a great set of graphical parameters such as colors, bar style, grid or bubble plots is entirely configurable.
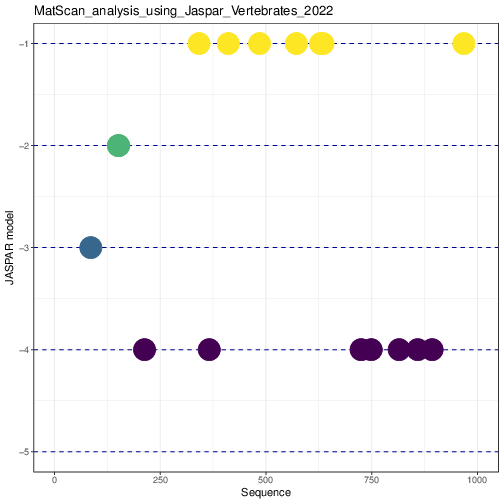
SeqCodeweb includes MatScan, a tool to scan a genomic sequence in search of TF binding sites according to JASPAR vertebrate core definitions. Predicted TFBSs are graphically shown in a plot, and if available, genomic information about the exact location of the sequence in a genome assembly provided by the user is employed to map predictions in a custom track for the UCSC genome browser.
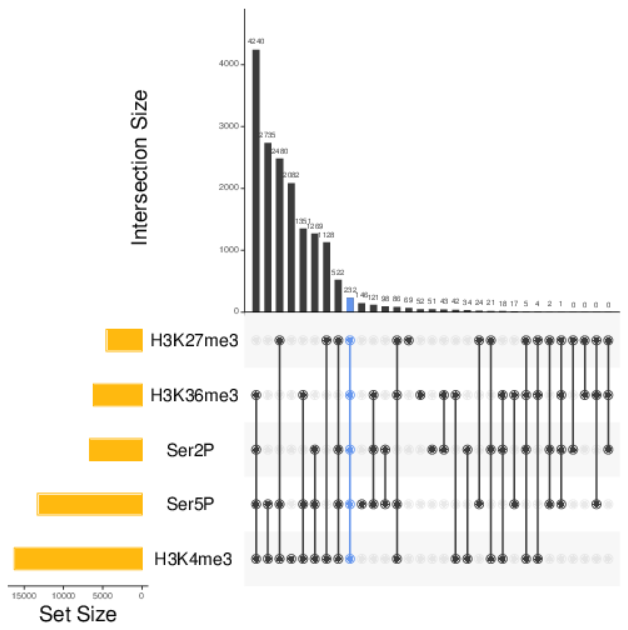
SeqCodeweb includes the option to generate Up Set plots from multiple lists of names. Using this graphical representation, users can compare the distribution of many combinations of the original set in a straightforward manner. It is possible to highlight the combination of elements that are present in all the lists.
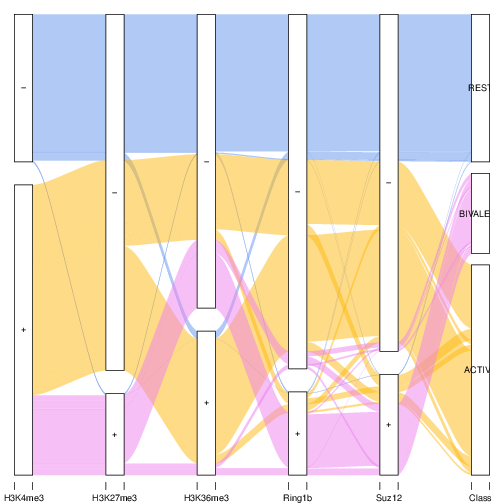
SeqCodeweb implements a service to produce alluvial diagrams from a list of genes classified by the user, and multiple lists of features stored in plain-text files. It is possible to cusotmize the graphical aspects of the resulting plot (colors of each information class).
SeqCodeweb implements several functions to work with lists of values stored in Tab-separated files. It is possible to find the lines that share a common value on both files, perform a fold-change analysis of the records of a single file or filter elements that fit into a particular condition.
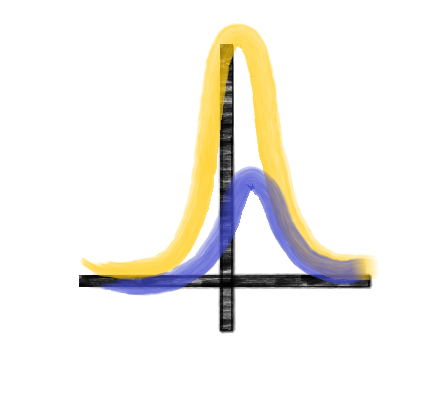
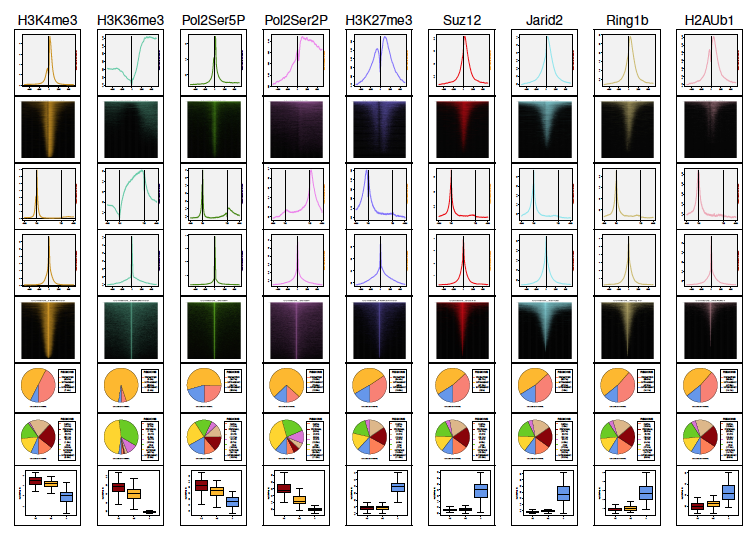
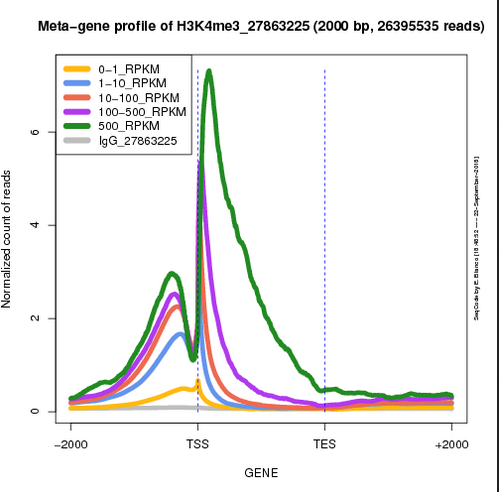
SeqCodeweb generates the average profile of the ChIPseq signal for a subset of genes, calculating the average number of reads within a given location to uncover certain predisposition. Users can choose to define the plot on the region around the TSS or along the gene body for multiple sets of genes from a catalog of published samples.
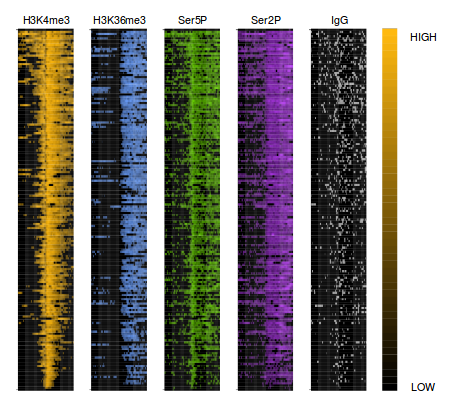
SeqCodeweb creates density heat maps as barcodes in which the signal of the selected ChIPseq experiment around the TSS of each individual gene is stacked into a single plot that is reorganized by sorting the average value of each row. Multiple maps of samples for the same gene set can be displayed together into the same picture.
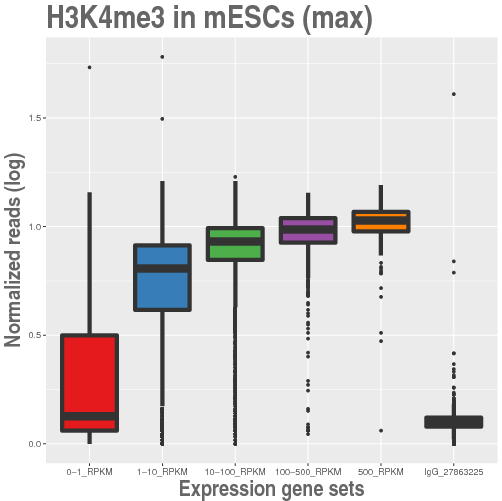
SeqCodeweb provides the option to determine the amount of signal around the TSS of a set of genes in a group of published ChIPseq experiments. The resulting distribution of values is shown as a boxplot. It is possible to show the number of normalized reads of the same condition on multiple gene sets for comparison.
SeqCode is provided with a comprehensive user manual describing the functions and the parameters of each web form together with a bunch of tutorials. Users will find multiple examples performed on real cases that explain the output of each service included into both web and standalone modes.


SeqCode open source code and binaries for MacOSX and LINUX are freely distributed under GPL license. A VirtualBox appliance running under Ubuntu MATE with the standalone version of SeqCode preinstalled inside is also available to test the program. A Docker container is also available running SeqCode.